Are Stocks Cheap Now?
All three major US stock indices (Dow, S&P 500, Nasdaq) are currently down roughly 30% from their recent peaks due to coronavirus fears and the impact on the economy. So that begs the question, are stocks cheap now? We’ll dig into a few takes. If you want an overview of investing in general, take a look at our Investing Cheat Sheet.
Jump to a section
• How do you value a stock?
• The Efficient Market Theory – what it’s all about
• More to the story
• Looking at price-to-earnings ratios
• Tracking the S&P 500 index
• What the Shiller P/E is showing us now
• Where does that leave us?
First, how do you value a stock?
We’re not going to get into the nitty gritty details here. But the basic idea for valuing a stock (or any investment) is to compare the current price to what you think it will earn for you in the future, between dividend payments (periodic cash payments from the company) and an increase/decrease in share price. And you also need to assume a fair return on your investment when you’re making the comparison.
So if all those future payments are just enough to give you a fair return on the current price, the stock is fairly valued. If all those future payments are not enough to give you a fair return on the current price, the stock is overvalued or expensive. And if all those future payments are more than enough to give you a fair return on the current price, the stock is undervalued.
Seems simple right? Well not really.
Those future payments are uncertain – it will depend on what happens with the business. And even deciding what a “fair” return is can be a little complicated. Some financial professionals spend a lot of time building complex models to try to figure out what these numbers should be.
At the end of the day, there’s a lot of uncertainty in deciding the “correct” value of a stock. And there will be a wide range of opinions as to whether individual stocks or the market as a whole are overvalued, fairly valued, or undervalued.
In fact, this difference of opinion is key to how financial markets work. At any given time, some people are buyers, and some people are sellers. And market prices move depending on how much buying vs selling goes on.
Efficient Market Theory – what it’s all about
If you ask an economist, they’ll typically tell you the market is always fairly priced because of the efficient-market hypothesis.
This basically says that because there are so many investors looking at and valuing the market at any given time, all available information that could help determine fair prices has already been accounted for, and the market will reflect this information.
So this means you’ll never be able to “beat the market” by finding undervalued stocks or by timing the market (deciding when to be in or out of the market). And you should just invest your money in the market broadly with low-cost index funds and not try to time when to get in and out.
While this is technically just a theory, most of the time it seems to be pretty accurate.
It’s really hard to beat the market and most professional investors trying to do so are ultimately not successful. And research tends to show that in fact it is generally best to invest in low-cost index funds and invest for the long term. For the most part, we stick to this assumption throughout our site.
But there may be more to the story
Despite the strength of the efficient-market hypothesis, it still is a theory. And as with any theory, it’s important to consider other possibilities.
There’s also a lot of research in the field of behavioral economics that suggests people aren’t entirely “rational” when making financial decisions. So psychology might play a bigger role than pure efficient market theorists would suggest.
In other words, panic and euphoria could be factors in how the market gets valued. Especially at extreme moments like we’re seeing now. (There can also be technical reasons why banks and other financial firms are forced to sell investments even when they don’t want to, but that’s another story.)
Stock markets have dropped about about 30% in the past few weeks, and it seems hard to justify that all the businesses in the world should now be worth 30% less than they were just a month ago. It could be the case, but it might also suggest more is going on. And maybe markets aren’t always perfectly efficient.
Looking at price-to-earnings ratios
So if you’re wondering if maybe markets do get “cheap” or “expensive” sometimes, what would you do to measure that?
One of the most widely used tools among investors is to look at the Price-to-Earnings ratio of a stock or index.
The idea is fairly simple. Take the share price of a stock and divide it by the per share earnings of the company. That’s the P/E ratio (Price/Earnings). It tells you what you would have to pay for $1 worth of that company’s annual earnings, aka profit.
So if the price of one share of stock for a company is $100, and that company is earning $5 per share, the P/E ratio would equal 20 (100/5 = 20).
Most financial websites that show stock prices will include the P/E ratio somewhere. Here’s an example with Apple stock using Yahoo Finance.
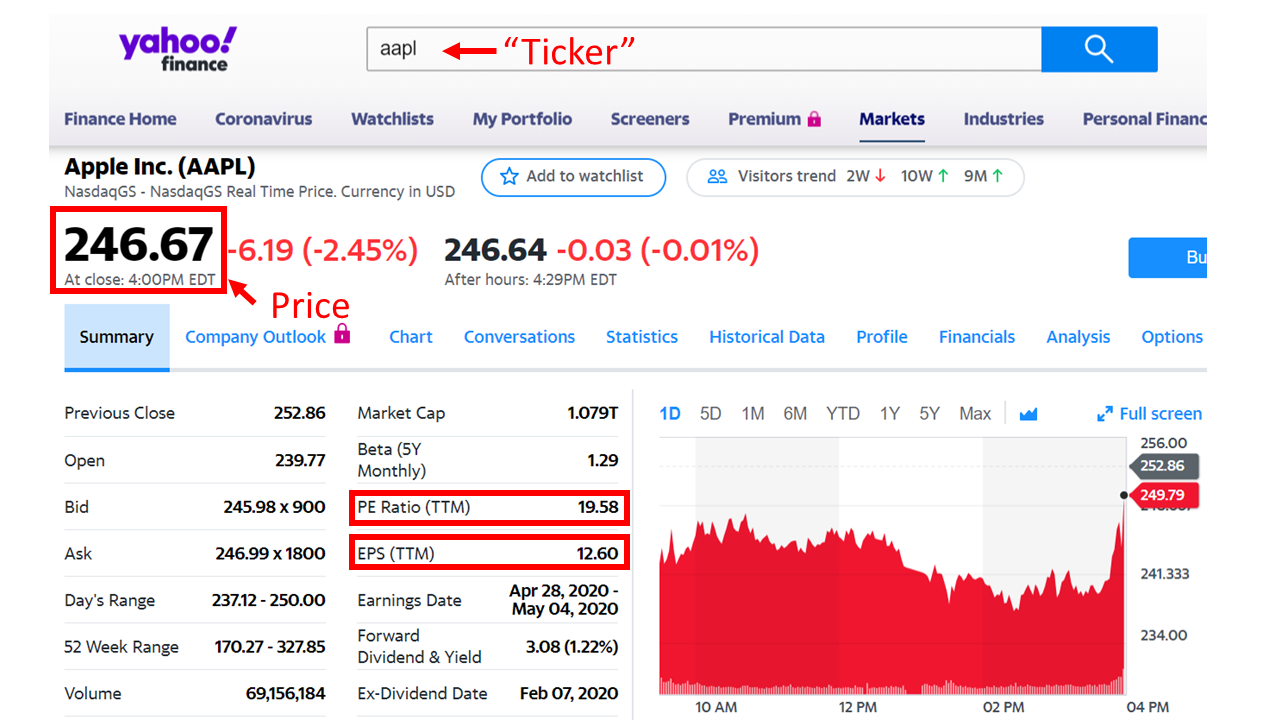
You would type in the company name (or stock “ticker” if you know it) at the top. Then it will tell you the current price, in this case, $246.67 per share, and the earnings per share, or EPS, which we’ve boxed in red at $12.60. Then to get the P/E you divide 246.67 by 12.60, which equals 19.58, which is also displayed on the screen (in the other red box).
Then you can track the P/E over time. A low P/E means the price of the stock is lower relative to the earnings. A high P/E means the price is higher relative to earnings. All things equal, you would want to pay a lower price relative to the earnings you’re buying (ie a LOW P/E ratio) because that means you’ll get more bang for your buck.
Different P/E ratios for different industries
But note, we said a lower P/E was better “all things equal”.
Different stocks and different industries tend to trade at different P/E ratios because all things are not equal. For companies or industries with strong growth prospects, you’d generally accept a lower P/E ratio. Even though the price might be high relative to current earnings, you expect those earnings to grow faster. And over time, the higher growth rate in earnings will make up for the higher price.
So investors will often look at the P/E ratio for an entire index, like the S&P 500, because that will do a better job of capturing the market as a whole.
They can then track that index P/E ratio over time to try to judge if the market looks cheap/expensive relative to history. If it’s cheap, you would expect above average returns going forward. If it’s expensive, you would expect below average returns.
Tracking the S&P 500 index
Based on the current price of the S&P 500 (as of 3/18/20), the S&P 500 P/E is about 17, which is only slightly higher than the long-term average of about 16. (The numbers can vary slightly depending on how long you’re averaging for and exactly how you calculate it). This would suggest stocks are not particularly cheap, but they’re well within the range of fairly valued.
But one issue with looking at the straight P/E ratio is that earnings tend to fluctuate somewhat, which would make the ratio less stable and therefore potentially misleading.
So economist Robert Shiller created a way to calculate the S&P 500 P/E ratio by using the 10-year rolling average of earnings, which helps to smooth out the numbers. His ratio is called the Shiller P/E or “CAPE ratio” (which stands for cyclically adjusted price-to-earning ratio), and he makes his data publicly available.
This version of the P/E has become wildly used among financial professionals and is often referenced in financial media. More importantly, it seems to do a pretty good job of identifying when the stock market is cheap/expensive (although no tool is perfect).
What the Shiller P/E is showing us now
As of right now (3/18/20), the Shiller P/E stands at about 22. Which, again, is above the long-term average of about 16 suggesting the broad stock market is not particularly “cheap” (at first glance). But there are some caveats.
Here’s a chart of the Shiller PE going back to the 1800s (yup, that’s a long time).
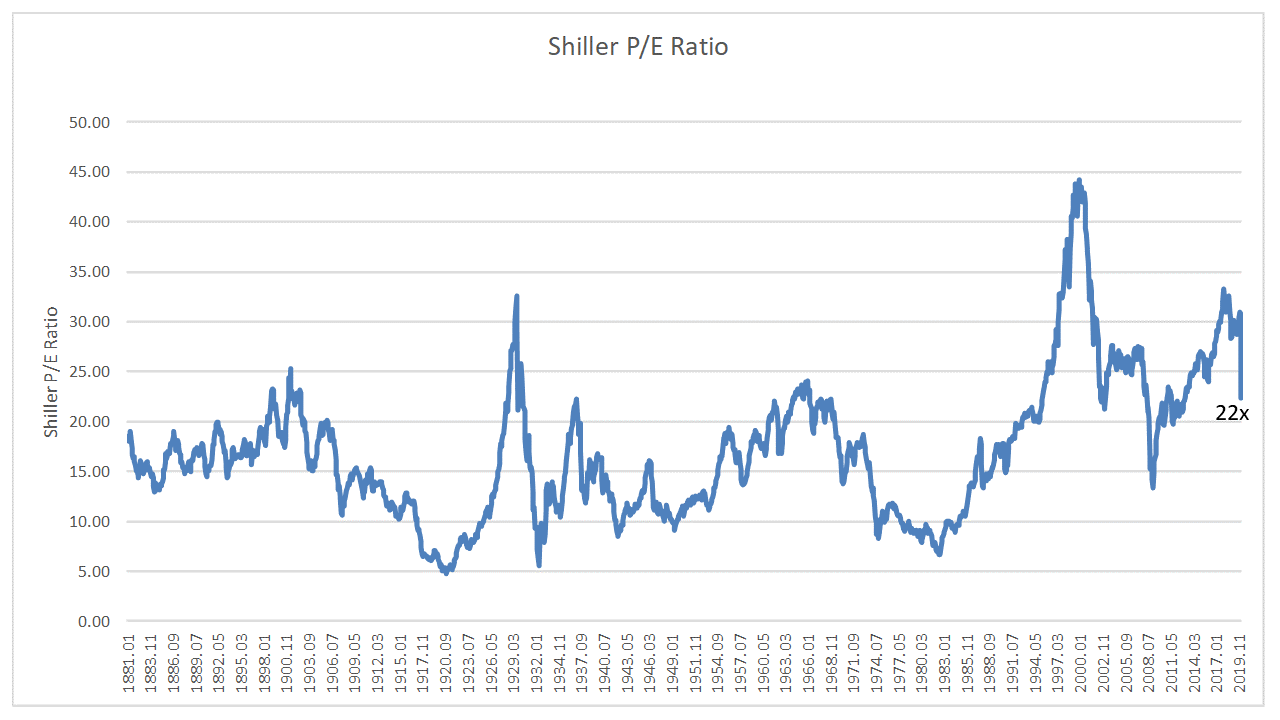
A few things to note. The ratio has come down a lot recently, which is of course due to the correction we’re experiencing. As prices come down, the P in P/E goes down, so the ratio decreases. Stock prices have fallen about 30%, so the ratio has also fallen about 30%. Earnings (the E) will likely take a big hit this year, but that isn’t factored into the ratio until it does.
As you can see, the ratio fluctuates over time. But you may also notice that it seems to be trending higher over time too. This is likely because more and more people are investing in the stock market, which drives up the price of stocks on average, which drives up the P/E, and likely lowers long-term average returns. Basically, demand for investments has grown over the past 100 years. So the average P/E going forward might be a bit higher than the long-term average of about 16.
So where does that leave us?
Well, all this likely means that stocks as a whole are still probably not particularly cheap in terms of a long-term investment horizon. But they are within a fairly reasonable valuation range, so they don’t seem to be super expensive either.
Of course prices have come down a lot in the past month and there’s at least a chance we’ll see some sort of rebound. But the Shiller P/E would suggest stocks were too expense leading up to the recent drop (although it doesn’t say anything about specific stocks or industries that may be undervalued).
It’s also important to keep in mind that stock prices tend to overshoot their mark during a correction, so they can easily fall below a “fair” value. This is especially true as panic takes over (which seems to be happening now to some degree).
Not to mention there’s a lot of uncertainty around the coronavirus and how it will impact the world and the global economy. And this will likely dominate the news cycle and financial markets in the near term. No one really knows how it will play out.
We generally don’t take positions on whether stocks are cheap or expensive, and we typically advocate for a long-term, diversified, buy and hold approach. But we do think the Shiller P/E can be a helpful tool in trying to assess long-term prospects for stocks. And at the moment, it seems to be suggesting “things might be okay”…Of course anything can happen in the short run.
As the situation continues to evolve, we’ll do our best to keep you informed with market updates and insights so follow us on social media @ findwesdotcom (Facebook, Twitter, Instagram). Or you can enter your email below – we won’t spam you with a lot of nonsense or share your information.
So stay tuned and be safe.
Anything else we can help you with?
►Learn about the Fed’s recent rate cut to 0%
► Check out our Investing Cheat Sheet for a general overview of investing
► Learn how to file your taxes quickly and easily with tax preparation software